OSHA+NIST+SRE: Incident Trend Analysis Playbook for LTC (6–12 months)

OSHA+NIST+SRE: Incident Trend Analysis Playbook for LTC (6–12 months)
Incident trend analysis turns recurring incident reports and near-miss data into prioritized risk reductions by combining leading and lagging indicators, structured postmortems, and ongoing dashboards. It works best with at least six months of consistent data, though a year or more gives you clearer, seasonality-adjusted patterns. Most operations, safety, or quality teams own the activity, and it pays off whenever incidents repeat often enough to have a pattern worth finding.
TL;DR:
- Incident trend analysis requires at least six months of consistent data, with a year or more offering clearer insights and seasonal pattern adjustments.
- Including near misses alongside incidents improves early risk detection, as both reveal underlying system weaknesses before harm occurs.
- Tracking both lagging indicators like injury rates and leading indicators such as hazard reports helps prevent focusing only on failure after events happen.
- Using smoothing techniques like moving averages and seasonal decomposition helps distinguish true trends from random fluctuations or short-term noise.
- Effective programs depend on standardized data capture, regular review cadence, and assigning clear ownerships for corrective actions to prevent stagnation.
Table of Contents
- What incident trend analysis covers and core concepts
- Key metrics and indicators to track
- Methods and techniques for detecting trends
- Tools, dashboards, and automation patterns
- How to set up a recurring incident trend analysis program
- Common pitfalls, validation, and what success looks like
- How MyLTCApps supports ongoing incident trend analysis
- Sources
- FAQ
What incident trend analysis covers and core concepts
Incident trend analysis only works when you define “incident” broadly enough to catch problems before they become serious. That means including near misses, not just events that caused harm or damage. A near miss reveals the same system weakness as a full incident, just without the bad outcome, and OSHA’s incident investigation guidance treats it as part of the same structured examination process used for injuries, illnesses, and security breaches.
Two categories of indicators do different jobs. Lagging indicators tell you what already happened: injury rates, complaint counts, cost of claims. Leading indicators tell you what is likely to happen next: near-miss reports, hazard identifications, training completion rates. OSHA’s program evaluation guidance recommends tracking both and grouping incidents periodically to surface emerging risks before they show up as injuries.
Cadence matters as much as the data itself.
- Operational teams should review trends monthly, when patterns are still fresh enough to act on.
- Leadership groups typically need only a quarterly view, focused on direction rather than detail.
- A six-month window supports basic pattern detection, while 12 months or more filters out seasonal noise and gives you a steadier baseline.
Key metrics and indicators to track
Picking the right metrics keeps a trend analysis program from drowning in numbers that do not mean anything on their own. A practical set combines outcome measures with activity measures, then normalizes both so comparisons across time or locations make sense.
- Lagging metrics: incident counts, severity ratings, recordable injury rates, days-away-restricted-transfer cases, and direct cost impact.
- Leading metrics: near-miss reports filed, hazards identified, training completions, and inspection or audit findings.
- Normalization: convert raw counts into rates, such as incidents per 1,000 hours worked, per occupied bed, or per device in service, so a busier period does not look artificially worse.
- Window selection: use counts for small, single-site datasets where rates would be misleading, and switch to rates once volume is high enough to support comparison across sites or shifts.
- Seasonality check: compare the same month or quarter year over year before declaring a spike abnormal, since predictable seasonal patterns (weather, staffing turnover, census changes) often explain short-term swings.
OSHA’s leading indicators guidance makes a useful distinction here: leading measures show whether preventive activity is actually happening, while lagging measures only confirm whether prevention worked after the fact. A program that tracks lagging metrics alone is measuring failure, not managing risk.
Methods and techniques for detecting trends
Raw incident counts are noisy. A single bad week can look like a crisis and a quiet month can hide a growing problem, so the methods below exist to separate signal from randomness.
- Moving averages smooth short-term volatility, turning a jagged weekly count into a trend line you can actually read.
- Seasonal decomposition separates a recurring seasonal pattern from an underlying trend, which matters for facilities with predictable cyclical pressure.
- Regression and simple time-series forecasting work once you have enough history, typically the 6 to 12 month window mentioned earlier, and help project where a metric is headed if nothing changes.
- Clustering by root cause, location, shift, or equipment type turns a pile of unrelated reports into a small number of recurring patterns worth fixing.
- Structured postmortems and root-cause analysis give every incident a consistent category, which is what makes aggregation possible in the first place. NIST’s incident handling guidance frames this as part of a full life cycle, from preparation through post-incident activity, and stresses that logging quality and event correlation are what make the later analysis meaningful.
Sample size matters more than most teams assume. A handful of events in a category is not enough to call something a trend, and a month with three incidents instead of the usual one can be ordinary variation rather than a real shift. Google’s engineering teams apply a related principle in postmortem culture: aggregating structured write-ups across many incidents reveals systemic weaknesses that a single postmortem never could, because one event rarely has enough context to justify a major investment on its own.
Pro Tip: Treat any spike under five events in a category as noise until a second period confirms it: one bad week rarely means what it looks like.
Tools, dashboards, and automation patterns
The right tool stack depends less on brand names and more on whether it captures clean, structured data and makes that data easy to slice. Four categories cover most needs.
- Structured incident capture systems that force consistent fields at the point of entry, rather than free-text narratives that have to be recoded later.
- BI dashboards that let you group by cause, location, shift, or equipment, and adjust the time window without rebuilding the report from scratch.
- Analytics engines capable of flagging anomalies automatically, so a real spike gets surfaced without someone staring at a spreadsheet every week.
- Ticketing and workflow systems that turn a flagged trend directly into an assigned corrective action with an owner and a due date.
A good operations dashboard does more than display numbers. It should support drilldowns into individual investigation notes, export action lists for meetings, and let you set alert thresholds tied to an escalation workflow, so a metric crossing a limit triggers a notification rather than waiting for the next scheduled review.
None of this works without data hygiene. A shared taxonomy, mandatory fields, accurate timestamps, and unique identifiers for every report are what let a dashboard aggregate hundreds of entries into a single, trustworthy trend line. Skip this step and every later analysis inherits the mess.
How to set up a recurring incident trend analysis program
Building a trend analysis program is a sequence, not a single project. Each step depends on the one before it.
- Define goals and scope. Decide what “success” means, whether that is fewer repeat falls, faster detection of maintenance failures, or better near-miss reporting rates, before picking a single metric.
- Standardize taxonomy and capture. Lock in required fields, categories, and severity definitions so every report from every shift looks the same on the back end. A related approach is covered in this guide to near-miss reporting.
- Select metrics, baselines, and thresholds. Pick the leading and lagging indicators from the earlier section, set a baseline from historical data, and assign an owner and review cadence to each one.
- Build dashboards and set meeting structure. Decide who meets, how often, and what they leave with. A monthly operations review and a quarterly leadership review is a common split.
- Convert trends into corrective action. Assign work tickets, track closure, and measure whether the fix actually changed the metric it was meant to move. Corrective action tracking is where most programs either prove their value or quietly stall.
A working program needs at least three roles: a data steward who owns taxonomy and data quality, an analyst who runs the numbers, and an operations owner who turns findings into assigned work. A simple monthly agenda covers new trends, open corrective actions, and closure status on last month’s items.
Pro Tip: Give every corrective action a due date and a named owner in the same meeting it’s assigned: trends that don’t convert into tickets tend to resurface within a quarter.
Common pitfalls, validation, and what success looks like
Most trend analysis programs fail in predictable ways. Inconsistent taxonomies mean the same type of incident gets coded three different ways across three shifts, which quietly breaks every later aggregation. Ignoring near misses removes the earliest warning signal available. Blaming individuals instead of systems shuts down honest reporting, since no one reports a near miss if it might get them written up. OSHA’s own guidance on incident investigation warns against stopping at “human error,” arguing that a real investigation asks “why” repeatedly until it reaches training gaps, tooling, supervision, or maintenance practices.

Validation closes the loop. Audit a random sample of reports for completeness and accuracy, and cross-check findings against other records such as maintenance logs or staffing rosters, a practice outlined in CISA’s incident management resource guide.
A persistent gap shows up even in well-resourced settings: many organizations report and analyze incidents but never verify whether the corrective action actually worked, according to a systematic review of critical incident reporting in hospitals. Success looks like the opposite: fewer repeat incidents in the same category, leading indicators trending upward, higher corrective-action closure rates, and shorter time between a pattern forming and someone noticing it.
— Philip
How MyLTCApps supports ongoing incident trend analysis
Trend analysis is only as good as the reports feeding it, and most facilities lose data quality at the point of capture, not in the dashboard. MyLTCApps is built for the care floor specifically, reachable in a few taps on a phone staff already carry, which raises how much actually gets logged in the first place.
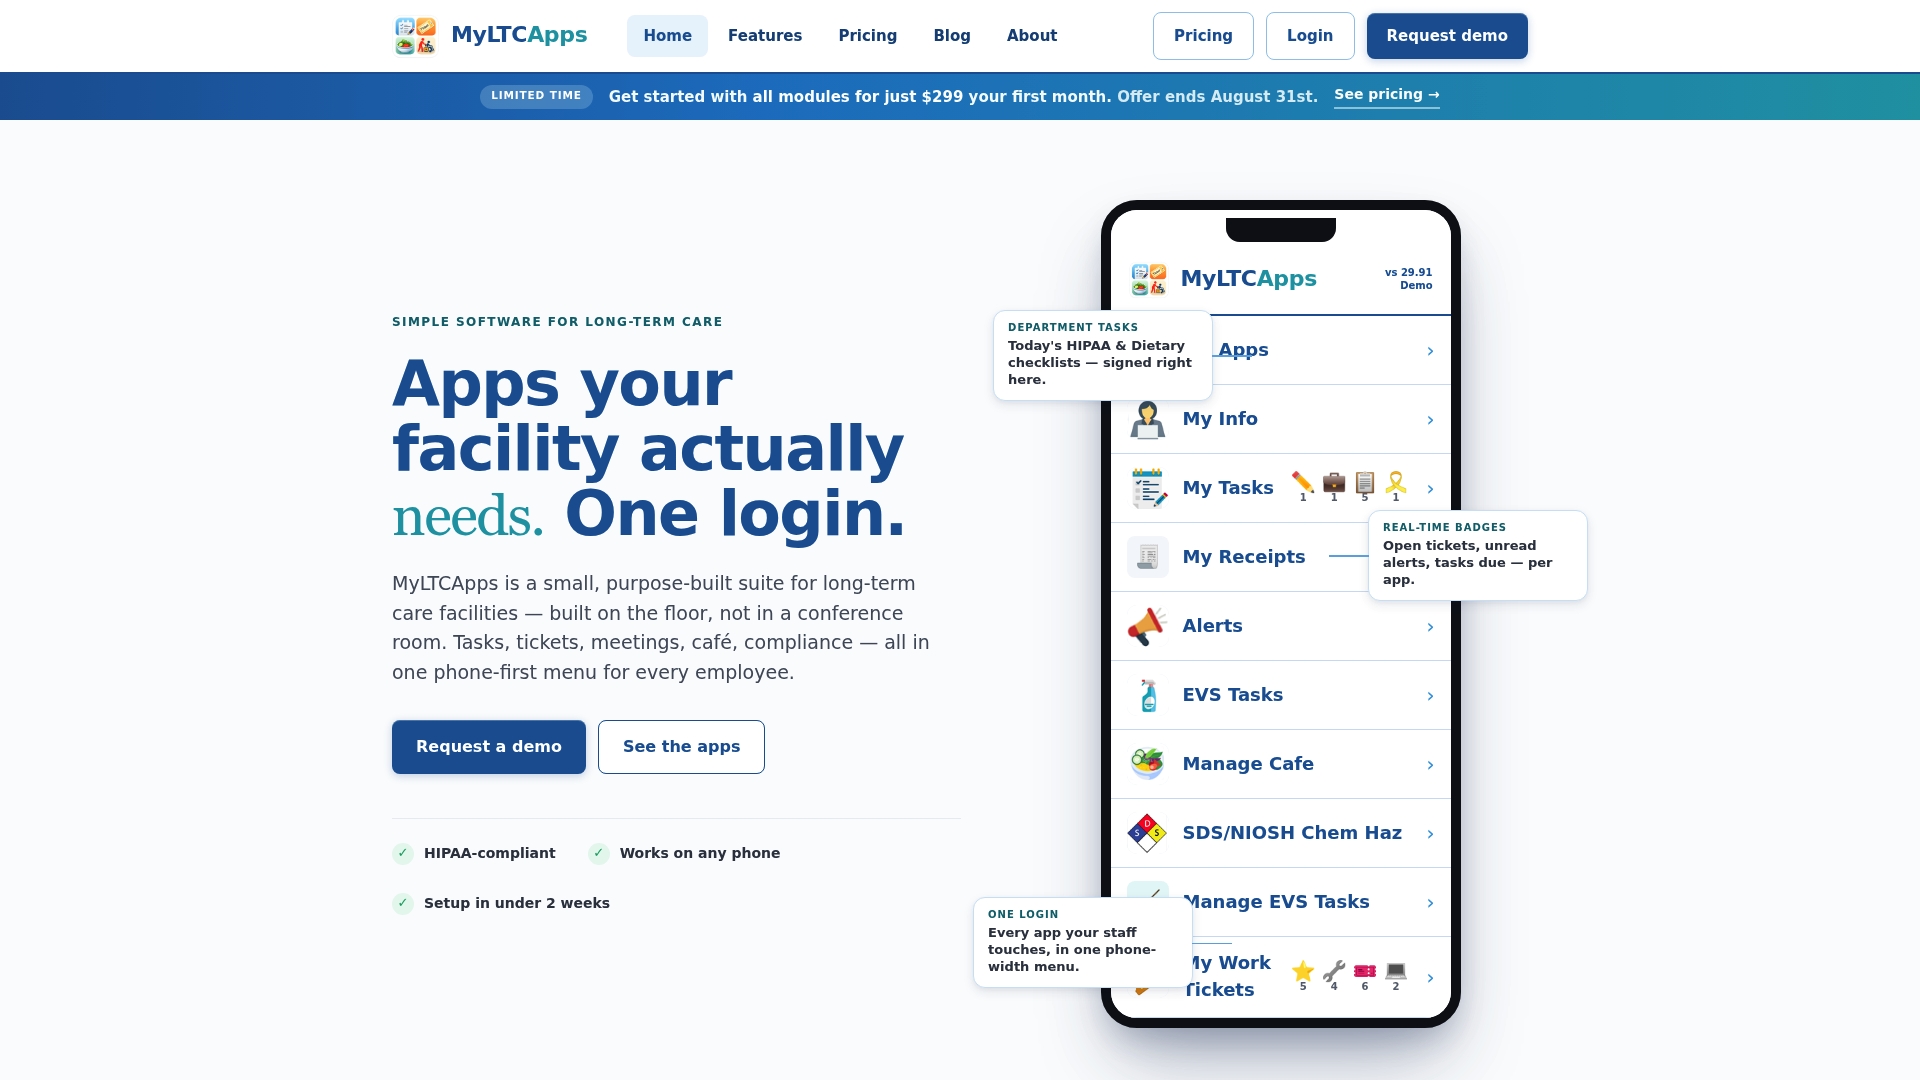
- Mobile-first incident and near-miss capture that staff can complete between tasks, not after their shift ends, without medical charting features.
- Seeded checklists and taxonomies that keep categories consistent across every shift, the same standardization this guide recommends.
- Work-ticket integration through My Work Tickets that turns a flagged trend directly into an assigned, trackable corrective action.
- Dashboards and exports built for recurring reviews and regulator-ready reporting, covered in the Compliance Suite.
Facilities can find current pricing details on the pricing page and request a walkthrough of how incident data flows from a phone screen into a monthly trend review.
Sources
These sources back the methods and figures used throughout this guide, and each covers a different piece of the picture.
- Incident Investigation | Occupational Safety and Health Administration (OSHA)
- Computer Security Incident Handling Guide (NIST SP 800-61)
- Postmortem culture | Google SRE
FAQ
What is incident trend analysis?
Incident trend analysis is the structured practice of examining incident and near-miss reports over time to find recurring patterns, root causes, and priorities for corrective action. It combines lagging indicators like injury counts with leading indicators like near-miss reports, reviewed on a regular cadence as described in OSHA’s program evaluation guidance.
What are the three types of trend analysis?
Trend analysis generally falls into qualitative pattern review, quantitative statistical methods like moving averages and regression, and hybrid approaches that pair structured postmortems with numerical metrics. Which type fits depends on data volume and how far back your history goes, typically the 6 to 12 month window discussed earlier in this guide.
What are the 5 stages of the incident management process?
NIST’s incident handling guidance frames the life cycle as preparation, detection and analysis, containment, eradication and recovery, and post-incident activity. The post-incident stage is where trend analysis happens, turning individual write-ups into recurring organizational insight.
What tools are commonly used for incident trend analysis?
Common tools include structured incident capture systems, BI dashboards with flexible grouping and drilldowns, analytics engines with anomaly detection, and ticketing systems that assign corrective actions. Mobile-first platforms such as MyLTCApps add structured, phone-based capture at the point of care, which improves the completeness of the data feeding those dashboards.
How much data do I need before I can spot a real trend?
A minimum of about six months of consistent, well-categorized incident data can support basic pattern detection, while 12 months or more produces more reliable trends adjusted for seasonal variation. Volume matters too: a category with only a handful of events needs a longer window before a pattern is distinguishable from ordinary variation.