The quality program,
running all year —
not the week before.
QAPI is where a skilled nursing facility runs Quality Assurance and Performance Improvement for real. Each department’s indicators arrive as a monthly task on the right person’s phone. Annual goals track against their targets. Performance improvement projects are opened as structured charters and kept honest by a board that surfaces the ones nobody has touched. Then the whole picture — data, goals, projects, the facility assessment — goes on the quality committee’s agenda as live numbers instead of a packet printed the night before.
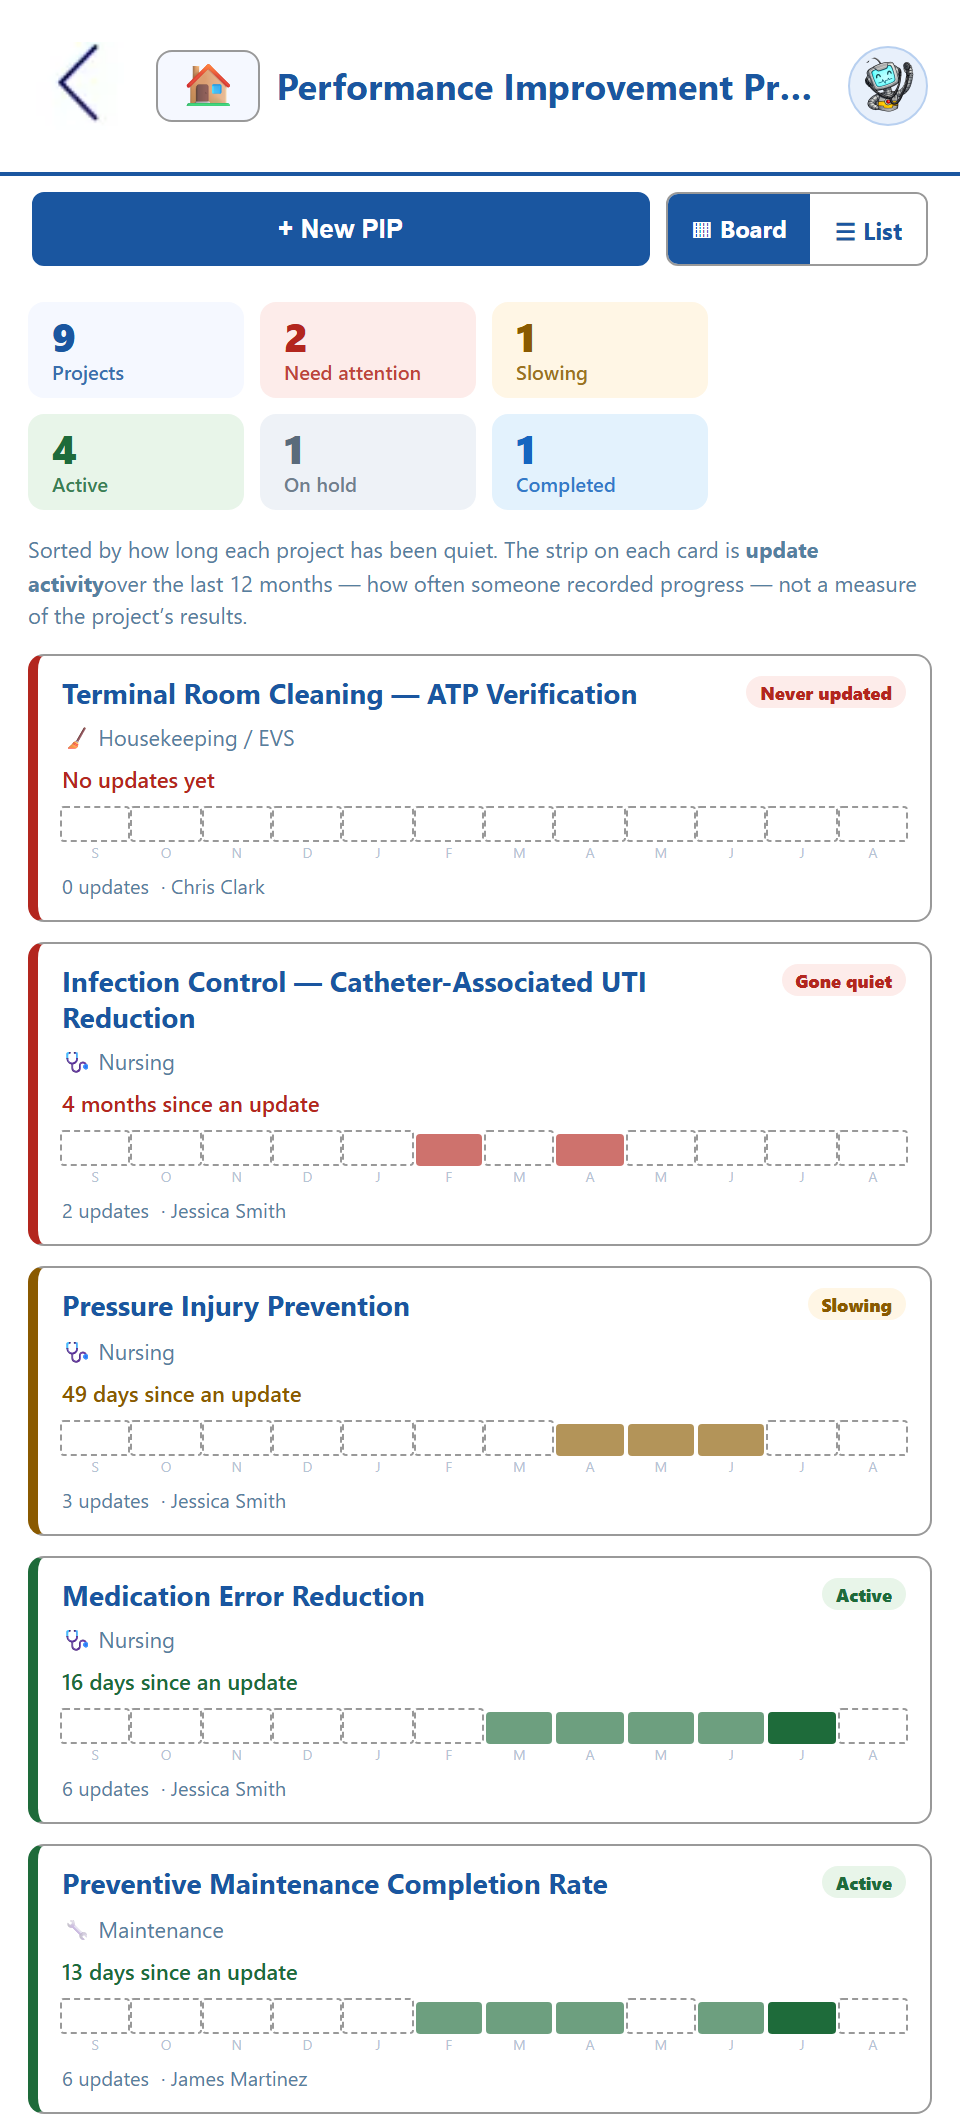
Complete QAPI, from the floor to the committee.
From one department’s monthly numbers to the improvement project the committee reviews — one connected quality program, built for the phone in a nurse manager’s pocket and the administrator’s desk.
A project the committee can actually follow.
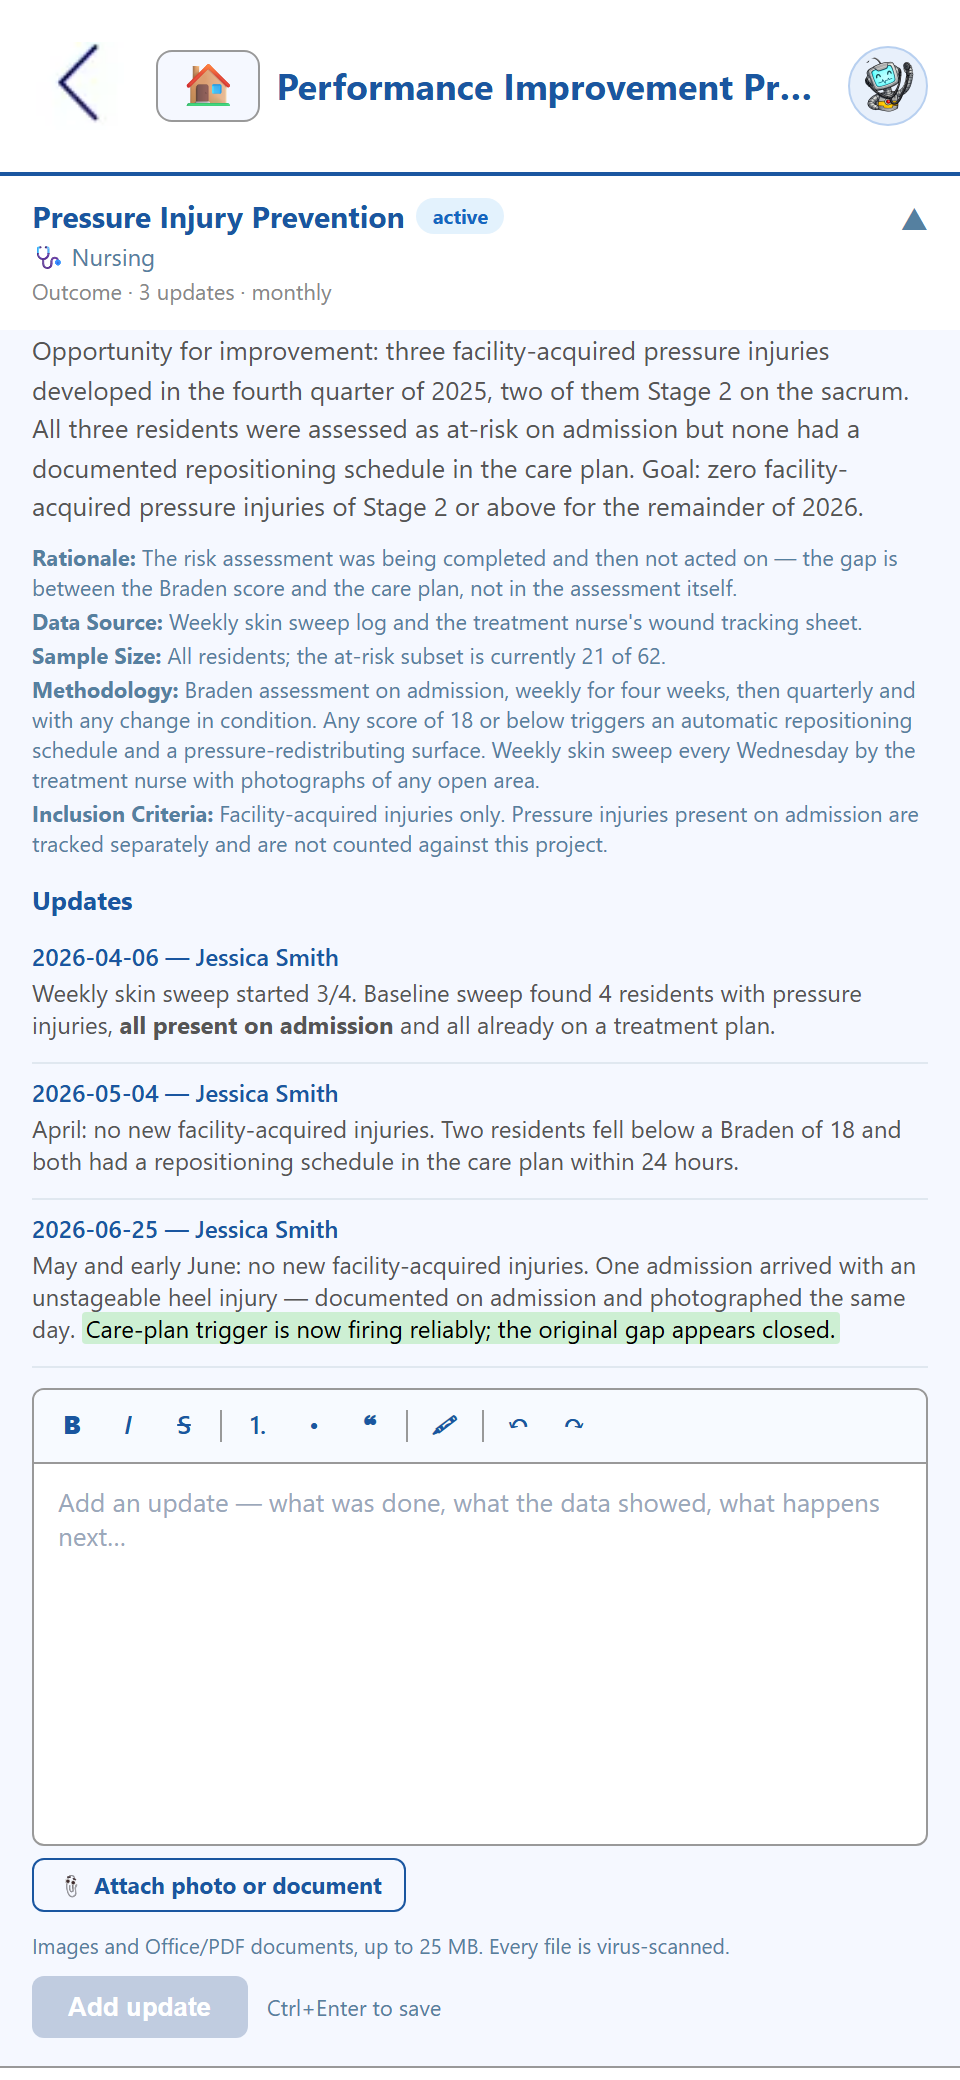
Every PIP opens as a structured charter — the problem, the rationale for taking it on, the data source, sample size, inclusion criteria, the methodology the team is using, and how often it will be updated. From there it keeps a dated log of progress notes with highlighting and photo or file attachments, each stamped with who wrote it. The board sorts the whole portfolio by how long each project has been quiet, so the improvement work that stalled in March surfaces in April instead of at the annual review.
- ✓ Structured charter — rationale, data source, sample, methodology
- ✓ Dated progress log with photos and file attachments
- ✓ Board flags projects nobody has updated
- ✓ Scoped to a department, with active / on-hold / completed status
Every department’s numbers, in one place, once.
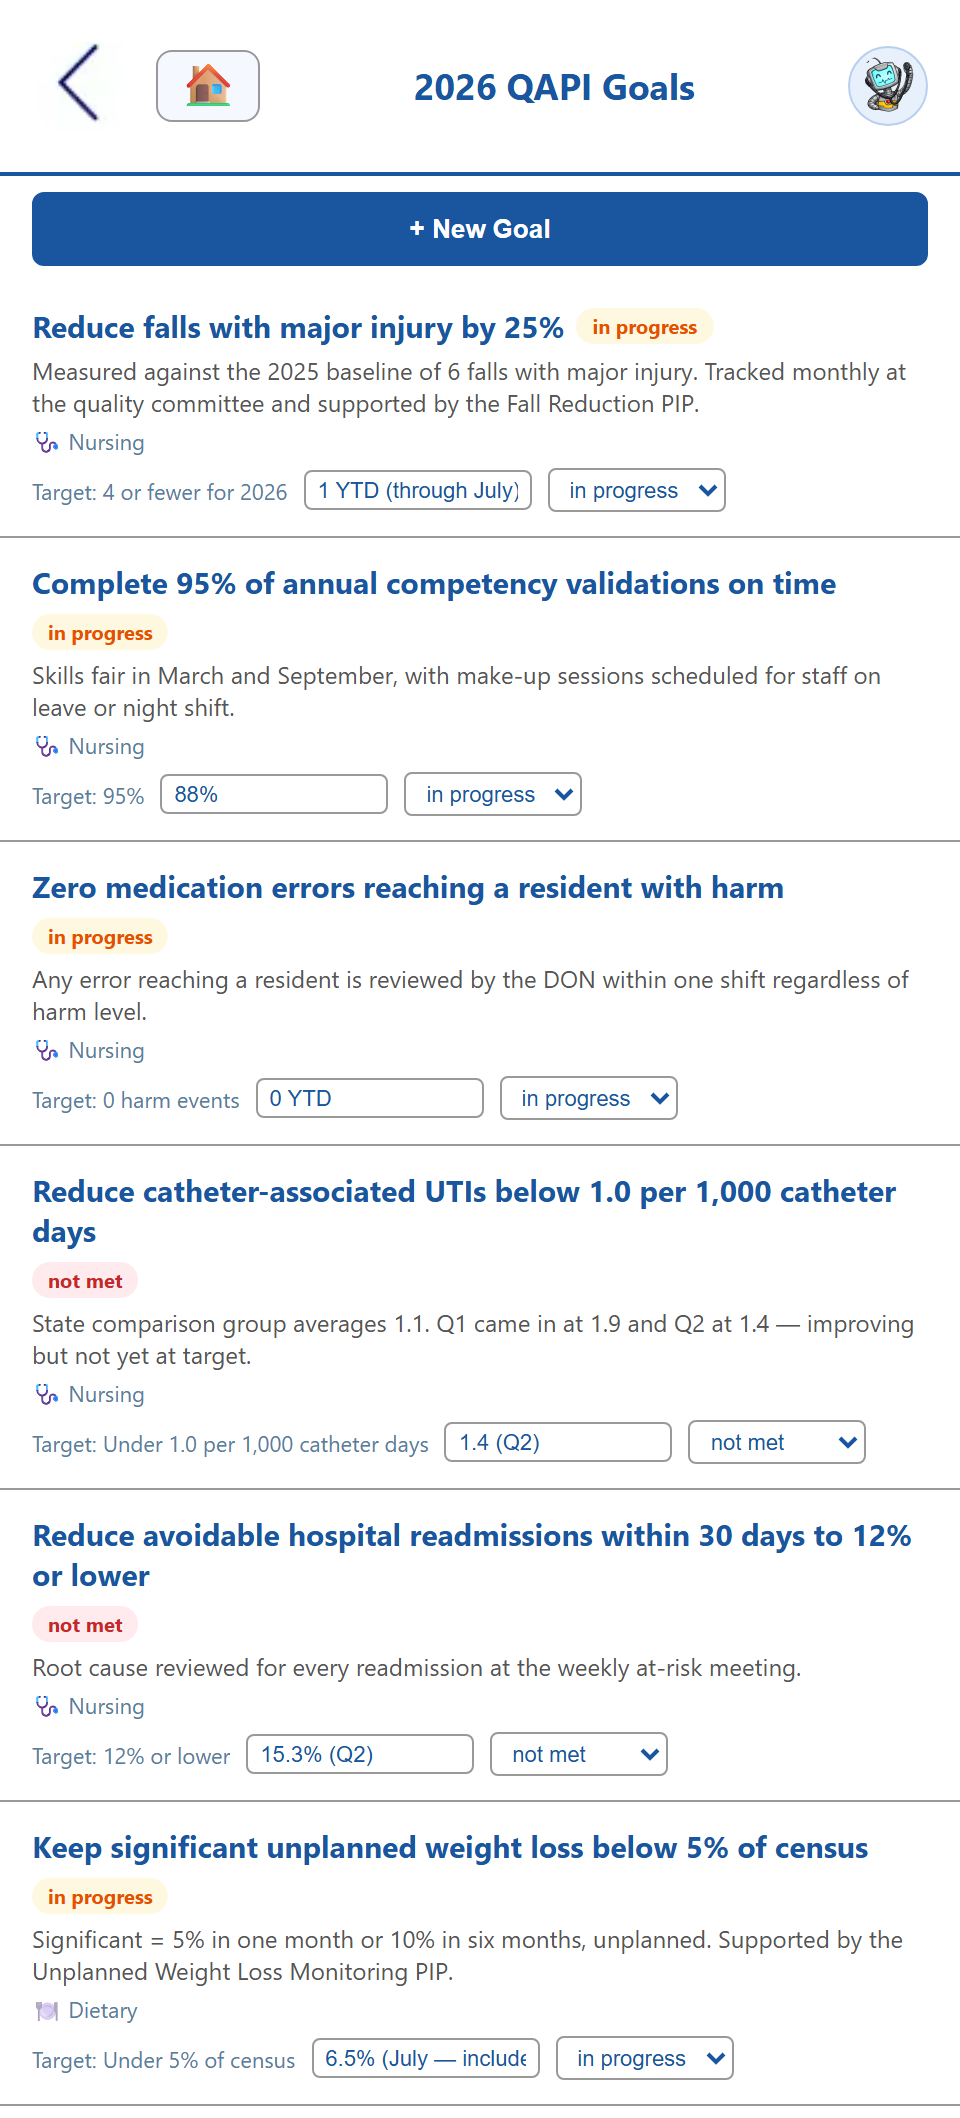
Quality indicators are organized department by department, each with its own reporting frequency, and each department’s numbers arrive as a monthly task on the responsible person’s phone for the month that just closed. The form and the dashboard write the same cell — one copy of every number, so the two can never disagree. Annual goals track a target against a current value by department, and measures already collected elsewhere in the system feed themselves in rather than being typed twice.
- ✓ Monthly, quarterly & annual indicators per department
- ✓ Reporting arrives as a task, not a reminder email
- ✓ Goals with target, current value & met status
- ✓ Auto-fed measures pull from the app that collects them
Quality data on the agenda, not in a packet.
Any line of a meeting agenda can carry live quality data, the concern and survey-follow-up review lists, specific improvement projects, the year’s goals, or the facility assessment itself. The committee reads current numbers during the meeting and records progress notes right there, and attendance and minutes stay on the same record. Your QAPI program is also one of the sections the CMS facility assessment draws live — so the assessment describes the quality program you are actually running, without anyone copying it across.
- ✓ Attach data, PIPs, goals or review lists to any agenda line
- ✓ Standing concern & survey-follow-up lists, curated in one place
- ✓ Record the facility assessment review from the meeting
- ✓ Separate hospital and long-term care programs on a mixed campus
Quality assurance & performance improvement, end to end.
Improvement projects, an activity board, progress notes, annual goals, department indicator entry, auto-fed measures, a watch list, and meeting integration — the quality program runs a little every month instead of all at once.
HIPAA-compliant, by design.
QAPI holds the clinical quality data your committee and your surveyors depend on, so it’s built to the same HIPAA standard as the rest of MyLTC Apps — encrypted, access-controlled, and hosted in U.S. data centers. Access is granted by group, so a department reports its own numbers without seeing the whole facility’s, and every entry, progress note, and goal change keeps a permanent, paperless audit trail.
QAPI software FAQ
How improvement projects, the activity board, quality goals, monthly department reporting, and meeting integration keep a skilled nursing facility’s quality program alive year-round.
What is QAPI software for nursing homes?
QAPI software gives a skilled nursing facility one place to run the Quality Assurance and Performance Improvement program CMS requires: the quality indicators each department reports every month, the annual goals set against them, and the performance improvement projects opened when a measure moves the wrong way. MyLTC Apps organizes indicators by department and section, issues each department’s monthly numbers as a task on the responsible person’s phone, keeps PIPs as structured charters with a dated progress log, and puts all of it on the quality committee’s meeting agenda as live data rather than a printed packet.
How do performance improvement projects work?
A PIP is opened as a structured charter — problem statement and description, the rationale for taking it on, the data source, sample size, inclusion criteria, the methodology the team is using, and how often it will be updated. From there the project keeps a dated log of progress notes with formatting and photo or file attachments, each stamped with who wrote it. Projects are scoped to a department and carry a status of active, on hold, or completed, so the committee can see the whole portfolio at once.
What does the PIP board show?
The board answers one question a flat list cannot: which of our improvement projects are still moving. It sorts every project by how long it has been since anyone recorded progress, counts the ones never updated or gone quiet as needing attention, and shows a twelve-month strip of update activity on each card. That strip is deliberately a measure of activity, not of results — the app reports the silence it can actually observe rather than inventing a performance trend from data nobody entered.
How do the monthly quality numbers get collected?
Each department’s indicators are issued as a monthly task for the month that just closed, landing on the phone of the person or group responsible for that area. Filling the form writes the same cells the quality dashboard reads — there is no second copy of a number and no sync step, so the form and the dashboard can never drift apart. Indicators can be monthly, quarterly, or annual, and a month an indicator isn’t collected in shows as not due rather than as a gap. Some measures feed themselves automatically from the app that already collects them.
Does QAPI connect to the facility assessment and our meetings?
Yes, and both connections matter. Your QAPI program is one of the sections the CMS facility assessment draws live, so the assessment describes the quality program you are actually running. On the meeting side, any agenda line can carry live quality data, the concern and survey-follow-up review lists, specific PIPs or goals, or the facility assessment itself — so the quality committee reviews current numbers on the agenda and records updates during the meeting. Meeting attendance and minutes stay on the same record.
See the apps on your own phone.
Drop your details and we'll email you a link to the live demo. Click around on your own time — pricing is right here whenever you're ready to sign up.