LTC Work Order Prioritization: Stop RED Overrides With Risk Scores

LTC Work Order Prioritization: Stop RED Overrides With Risk Scores
Prioritize work orders by safety impact and asset criticality using a simple numeric index, not by who asked loudest or when the request came in. A cross-functional triage team, Operations and Maintenance together, should score every new request against that index before it hits the schedule. Lock the priority field inside your CMMS or mobile work-ticket system so nobody can quietly bump a low-risk job to the top.
TL;DR:
- Rate the worst applicable consequence, multiply it by likelihood on a 1 to 5 scale, then pilot whole number priority bands before rollout.
- Set Required End Dates automatically from priority bands, restrict edits to named roles, and require written reasons for overrides without blocking emergencies.
- Run daily triage, review aging high priority jobs weekly, and audit overrides monthly; break the frozen schedule only for work with genuinely higher priority.
- Track backlog and overdue work by priority, schedule adherence, and Required End Date edits; delays in closing safety work can signal a failing process.
- In long term care, elevate call systems, lifts, clinical area emergency power, and life safety systems; score resident occupied spaces and isolation room ventilation by context.
Table of Contents
- Seven Practical Best Practices for Work Order Prioritization
- Priority Scoring Matrix and Template: Score Consequence, Likelihood, and Business Impact
- Create a Work Priority Index (MPI) in Four Steps and Pilot It
- Enforce Prioritization With Phone-First Work Tickets and CMMS Controls
- Governance, Roles, and Cadence That Keep Priorities Honest
- Backlog Metrics and a Minimal Reporting Set to Prove It Is Working
- Examples of Prioritization Criteria Specific to Long-Term Care Facilities
- Impact of Prioritization on Staff Workload and Resident Care Outcomes
- Strategies to Update and Adjust Priorities Based on Changing Conditions or Emergencies
- Favor Simple Rules That Are Mission-Aligned and Train to Them
- MyLTCApps: Phone-First Work Tickets That Support Prioritized Execution
- FAQ
- Sources
Seven Practical Best Practices for Work Order Prioritization
Most backlogs do not grow because teams lack effort. They grow because priority gets decided case by case, with no shared rule, so the squeaky wheel wins and genuinely critical work waits.
Fixing that starts with a short list of habits that are easy to enforce and hard to argue with.
- Define criticality in terms specific to your facility and tied to safety and operational goals, not a generic industry template, an approach PNNL and SMRP recommend before any ranking work begins.
- Run a short Operations and Maintenance triage on every new request so priority is a joint call, not a single department’s guess.
- Use a short risk matrix, consequence times likelihood, instead of a complicated model nobody will keep updating.
- Restrict who can edit the Required End Date (RED) field and log every override with a reason.
- Protect the frozen weekly schedule: let in-progress work finish rather than bumping it for a new request of equal priority.
- Train staff on what each priority code means and audit compliance monthly.
- Standardize priority bands that map directly to scheduling windows, so a priority level always means the same turnaround.
Pro Tip: Post the priority-to-timeline table where requestors can see it. Half of all “urgent” mislabeling disappears once people know what the categories actually promise.
Practitioner discussions on corrective maintenance consistently name RED manipulation as the most common way a priority system quietly breaks down, which is why the edit restriction above matters more than it sounds.
Priority Scoring Matrix and Template: Score Consequence, Likelihood, and Business Impact
A scoring matrix turns a subjective request into a number your CMMS can sort on. Build it around three inputs.
- Consequence categories: rate the potential outcome if the issue goes unaddressed across safety, environmental exposure, operations loss, quality or resident/customer impact, and regulatory exposure. Use the worst applicable category, not an average.
- Likelihood scale: score near-term failure probability on a simple 1 to 5 scale, from “unlikely in the next scheduling cycle” to “failure is already underway.”
- Combine into a risk score: multiply consequence by likelihood to get a base number, then map ranges of that number to priority bands (for example, 20 to 25 equals Priority 1, 10 to 19 equals Priority 2, and so on).
- Optional business-impact multiplier: apply a small multiplier, such as 1.2, to assets tied directly to revenue or service continuity, so a near-identical fault on a critical line outranks the same fault on a redundant one.
- Keep precision low: use whole numbers only, not decimals, and test the matrix against a pilot set of 15 to 20 assets before rolling it out facility-wide.
This mirrors the structured logic in EPRI’s System and Equipment Reliability Prioritization approach, which computes a maintenance priority index from system criticality, operational criticality, and an asset-failure probability factor. You do not need EPRI’s full formula to get the benefit; a simplified version of the same logic works for most facilities.
Create a Work Priority Index (MPI) in Four Steps and Pilot It
Once you have a scoring matrix, turning it into a working index is mostly a matter of sequencing.
- Assign criticality: bin each system and component into simple criticality tiers (critical, needed, non-critical), or use formal System Criticality Rating and Operational Criticality Rating if your CMMS supports it.
- Score risk: multiply consequence by likelihood for the specific fault being reported to get a base risk number.
- Add a failure-probability factor: adjust the base score using an asset condition or failure-probability factor (AFP), so a part already showing wear scores higher than an identical part in good condition. This produces your maintenance priority index, following the same SCR times OCR times AFPF logic EPRI documents for its MPI model.
- Map MPI to buckets and pilot: assign MPI ranges to priority levels, populate Required End Dates automatically from those levels, and run the whole thing on one asset group or building wing first.
During the pilot, track backlog age and schedule stability, specifically what share of the weekly schedule gets broken by new high-priority interruptions, since that combination shows whether the index is actually changing outcomes rather than just reordering a spreadsheet.
Enforce Prioritization With Phone-First Work Tickets and CMMS Controls
A scoring model only works if the system enforces it. That means specific fields and rules, not just a priority dropdown.
Build these fields into your work-ticket or CMMS record:
- Asset criticality tier, consequence score, and likelihood score, captured at intake.
- The computed MPI and the Required End Date it generates.
- A named triage owner and a visible override log for any manual change.
Automation does the enforcing: auto-populate the RED from the computed priority, lock that field from edits except for named roles like a maintenance supervisor, and require a written triage note whenever someone overrides the default.
A phone-first interface matters here because triage happens in the moment, often from the floor rather than a desk. Faster capture at the point of request means fewer gaps between when a hazard is reported and when it is scored. One internal case study on backlog reduction found that facilities applying a structured work-ticket index alongside mobile enforcement cut maintenance backlog by 40 to 60% within 90 days, largely by closing the gap between intake and triage rather than by doing more total work.
A useful pilot report tracks three things: the RED edit rate, the priority distribution across open work orders, and backlog volume broken down by priority level. For facilities managing clinical or life-safety equipment specifically, guidance on medical equipment maintenance scheduling offers a useful reference point for how criticality tiers get assigned in health care settings.
Governance, Roles, and Cadence That Keep Priorities Honest
A scoring model survives only if someone owns each step of the process and a routine forces review. Four roles cover most facilities:
- Requestor: submits the work order with enough detail to score it, but does not assign priority.
- Triage owner: a joint Operations and Maintenance function that scores and assigns priority on intake.
- Planner or scheduler: slots prioritized work into the weekly schedule and protects it from mid-week reshuffling.
- Craft lead: executes and flags any mismatch between assigned priority and what they find on site.
Daily triage should happen at a set time, not on an ad hoc basis, and the frozen weekly schedule should only be broken for a genuinely higher-priority item, never an equal one. A weekly backlog scrub re-checks aging high-priority work orders that have not moved, since an item stuck at Priority 1 for three weeks usually signals a resourcing problem, not a scoring error. Monthly audits of RED edit frequency and priority distribution catch drift or gaming before it becomes culture.
Backlog Metrics and a Minimal Reporting Set to Prove It Is Working
A short dashboard tells you whether the index is changing behavior, not just adding paperwork. Five numbers cover most of it:
- Backlog volume by priority level, tracked weekly.
- Average age of open work orders, broken out by priority.
- Percentage of work orders overdue against their Required End Date, by priority.
- RED edit rate, flagged whenever it rises outside the named-role exceptions.
- Schedule adherence: the share of the frozen weekly schedule actually completed as planned.
Multiplying risk score by age flags systemic risk building quietly. A Priority 2 item sitting open for 40 days is a different problem than a Priority 2 item open for four, even though both show the same priority label. OSHA’s common statistics on workplace safety context underscore why safety-coded work orders deserve their own closure-rate tracking, separate from the general backlog view, since a slipping closure rate on safety items is the single clearest early warning a prioritization system is breaking down. These same metrics also inform staffing and capital decisions: a persistent backlog at Priority 1 and 2 levels is a resourcing argument, not just a scheduling one.
Examples of Prioritization Criteria Specific to Long-Term Care Facilities
Long-term care settings carry prioritization weight that a typical commercial facility does not, because resident safety and clinical continuity sit on top of standard operational concerns. A few criteria show up consistently in these environments:
Resident-occupied space takes precedence over vacant or administrative areas for anything touching heat, water, or air quality, since residents often cannot simply relocate while a repair happens. Equipment tied to resident care, such as call systems, lift equipment, or emergency power to clinical areas, is treated as critical regardless of how minor the fault looks on paper. Life-safety systems, fire alarms, sprinkler coverage, and emergency lighting get automatic top-tier scoring, consistent with the worst-first logic OSHA’s interpretation on PHA scheduling describes for documenting prioritization rationale based on hazard extent and the number of people potentially affected.
Infection control considerations also shape criticality in ways a general facility matrix would miss: a failed exhaust fan in an isolation room scores differently than the same fan in a storage closet. Dietary and kitchen equipment tied to resident meal service often gets elevated priority too, since a delay there affects care delivery on a fixed daily schedule rather than a flexible operational one. Building these distinctions into your criticality tiers up front keeps the index aligned with what actually matters in a care setting, rather than forcing resident-facing work through a generic commercial-facility scale.

Impact of Prioritization on Staff Workload and Resident Care Outcomes
A clear prioritization system changes daily workload in a specific way: it reduces the number of decisions a technician or charge nurse has to make about what to do next. Without a shared index, staff spend time negotiating which request is “really” urgent, which pulls attention away from both maintenance work and direct care tasks.
When priority is scored at intake and enforced through the schedule, staff get a consistent answer instead of a judgment call every time. That consistency matters most in care settings, where a maintenance delay, a broken call button, a malfunctioning lift, a slow HVAC repair in a resident wing, can translate directly into a care gap, not just an inconvenience.
A well-run triage process also reduces the volume of true emergencies over time, since issues get addressed at Priority 2 or 3 before they degrade into a Priority 1 safety event. That shift lowers the number of disruptive, unscheduled interruptions to both maintenance crews and care staff, which in turn stabilizes the weekly schedule everyone is working against. The practical effect for frontline staff is fewer surprise escalations and a clearer sense of what to expect from the maintenance side of the operation on any given day.
Strategies to Update and Adjust Priorities Based on Changing Conditions or Emergencies
A static priority index eventually stops matching reality, so it needs a mechanism for change that does not require rebuilding the whole system. A few strategies keep it responsive.
Build a defined override path for true emergencies, a sudden water leak, a life-safety alarm, a power loss in a clinical area, that lets the triage owner bypass the normal scoring delay while still logging the override and the reason. This keeps emergency response fast without quietly eroding the discipline of the scoring system for everything else.
Review criticality tiers on a set schedule, not just when something breaks. An asset that was non-critical a year ago may now support a new program or a higher resident census, and the tier should reflect that. Seasonal and regulatory shifts matter too: a facility’s HVAC criticality during a heat advisory, or fire-system criticality ahead of a survey window, can justify a temporary adjustment to priority bands rather than a permanent rule change.
Finally, treat every emergency override as data. Historical technical reports on automated prioritization systems from Oak Ridge show that weighted scoring systems hold up at scale precisely because the weights get revisited based on real outcomes, not left untouched indefinitely. A quarterly look at override frequency and cause tells you whether your scoring weights still reflect the facility’s actual risk picture or need adjusting.

Favor Simple Rules That Are Mission-Aligned and Train to Them
The most durable prioritization systems I have seen are not the most sophisticated ones. They are the ones a triage team can apply consistently without a spreadsheet open, because the criticality definitions map to what the facility actually cares about.
The real work is not building the formula. It is training Operations and Maintenance to apply it the same way every time, and holding both sides accountable when they do not.
— Philip
MyLTCApps: Phone-First Work Tickets That Support Prioritized Execution
We built My Work Tickets around exactly this kind of enforcement: mobile-first intake, priority fields, automated Required End Dates, and reporting exports your triage team can act on in three taps.
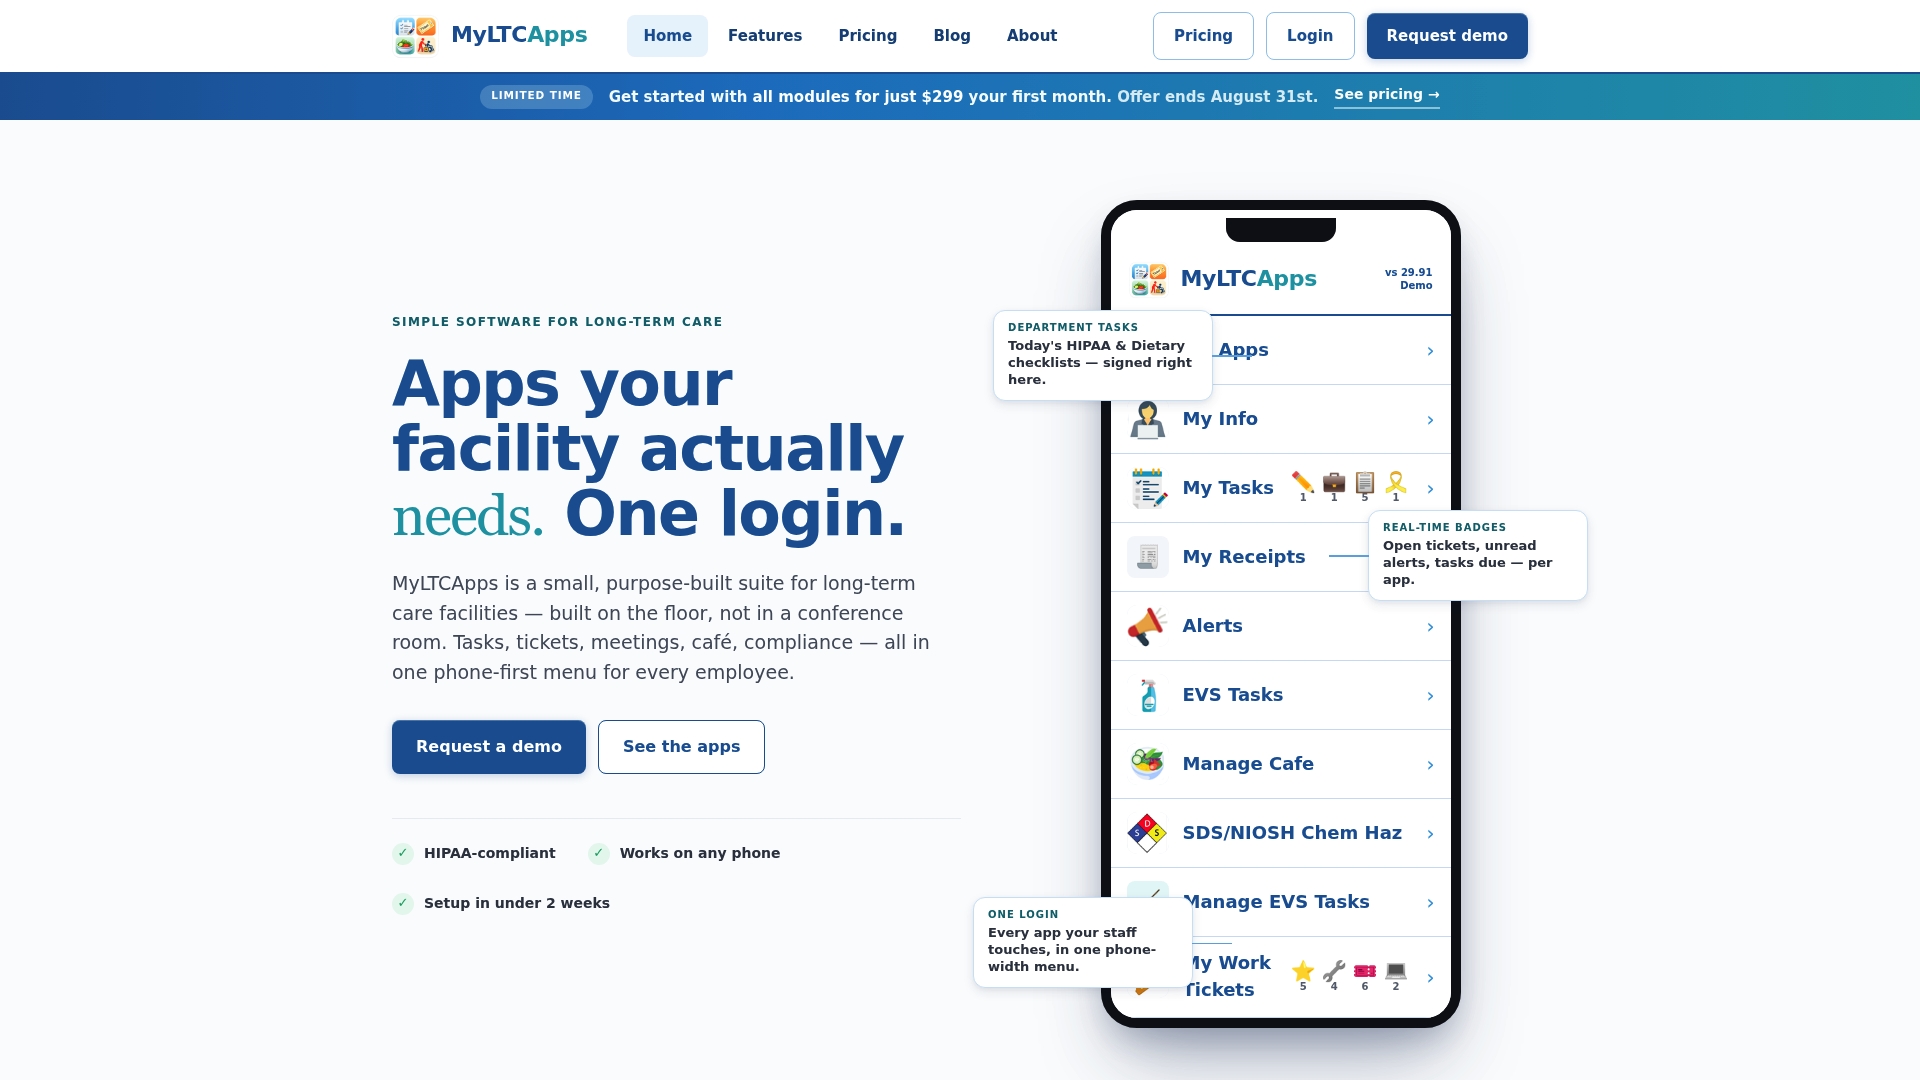
Facilities applying this structured approach alongside our Compliance Suite have seen backlog drop 40 to 60% within 90 days. See pricing and plans to get started.
FAQ
What Are the Five Levels of Priority?
A common model uses five bands: Critical or Emergency (immediate), High (within days), Medium (within 2 to 4 weeks), Low (within 8 or more weeks), and Scheduled or Planned (tied to a maintenance calendar rather than urgency). Exact labels and timelines vary by facility, so the key is defining what each level actually guarantees and enforcing it consistently.
What Is the 1-3-5 Rule for Prioritizing Tasks?
The 1-3-5 rule is a general productivity framework where someone plans to complete 1 big task, 3 medium tasks, and 5 small tasks in a day. It is not a maintenance-specific method and does not account for safety or asset criticality, so most maintenance teams use a risk-based matrix instead for work order ranking.
What Is the Three-Priority Rule?
There is no single standardized “three-priority rule” in maintenance management; definitions vary by organization. A common simplified version collapses priority into three tiers, critical, important, and routine, as a lighter alternative to a five-level system for smaller teams.
What Are the Four Methods of Prioritization?
Four approaches commonly used in maintenance settings are: worst-first or risk-based scheduling, which OSHA’s standard interpretation accepts when the rationale is documented; a consequence-times-likelihood risk matrix; a weighted maintenance priority index combining criticality and failure probability, as in EPRI’s SERP model; and simple criticality binning into tiers like critical, needed, and non-critical.
How Often Should Work Order Priorities Be Reviewed?
Daily triage should set initial priority for new requests, while a weekly backlog scrub re-checks aging high-priority items that have not moved. Monthly audits of priority distribution and override logs catch drift or manipulation before it affects scheduling.
Sources
- Prioritizing operations & maintenance actions (PNNL project page)
- The MIG Program: Prioritization of maintenance work requests (OSTI technical report)