Cut Maintenance Backlog 40–60% in 90 Days for Facility Managers

Cut Maintenance Backlog 40–60% in 90 Days for Facility Managers
Maintenance backlog management means measuring every open, approved work order in labor hours, then deliberately clearing it faster than new work arrives. The single most important move is converting that pile of tickets into a number, backlog weeks, and reviewing it every week. Facilities that skip this step usually discover their backlog only after something breaks.
TL;DR:
- The total backlog in weeks is calculated by dividing the total approved labor hours by the weekly productive labor hours of the maintenance team, emphasizing regular review.
- Proper prioritization involves scoring assets based on criticality, risk, and mission impact using a weighted index and scheduling high-scoring tickets first within an 80 percent workload rule.
- Cleaning the backlog requires merging duplicate tickets, removing unapproved wishlist items, and reviewing old tickets to prevent inflated or obsolete counts.
- Focusing on weekly discipline, grouping jobs by location and skills, and reserving capacity for backlog clearance can reduce backlog by up to 60 percent within three months.
- Integrating predictive maintenance and automation helps shift repairs from reactive to scheduled, lowering emergency costs and improving overall asset reliability.
Table of Contents
- What a Maintenance Backlog Includes and Why It Matters
- How to Calculate Backlog (Formula and Worked Example)
- Prioritization Frameworks to Cut the Backlog Fast
- Cleaning the Backlog: Purge, Validate, and Standardize Work Orders
- Scheduling and Execution: Weekly Cadence, CMMS, and Resource Matching
- Benchmarks and KPIs to Track Progress
- Sustaining Results: Governance, Communication, and Funding the Proactive Program
- How MyLTCApps Supports Backlog Management in Long-Term Care Facilities
- Impact of Maintenance Backlog on Asset Reliability and Operational Costs
- Integration of Predictive Maintenance to Minimize Backlog Growth
- Author’s Perspective: Practical Tradeoffs in Backlog Work
- How MyLTCApps Can Help
- Sources
What a Maintenance Backlog Includes and Why It Matters
A maintenance backlog is every work order that has been approved, scoped, and is ready to schedule, but hasn’t been completed. It does not include long-range capital projects, work already assigned to outside contractors on fixed timelines, or “someday” wishlist items nobody has actually approved. Mixing those in inflates the number and makes it useless for planning.
What belongs in the count:
- Corrective work orders awaiting labor or parts
- Approved preventive maintenance (PM) tasks that slipped their due date
- Safety and compliance repairs not yet closed
Unmanaged backlog compounds. A blocked door closer today becomes a failed fire door inspection next month. Facilities with disorganized backlogs see 34% higher emergency repair costs and 2.7 times more occupant complaints than those running a structured process. Tracking backlog size also gives you leverage: pairing it with a facility condition assessment turns “we’re behind” into a specific capital request with dollar figures attached.
How to Calculate Backlog (Formula and Worked Example)
The standard formula comes from plant maintenance benchmarking: backlog in weeks equals the man hours of available approved work divided by your department’s weekly man hours of capacity. That’s it. No software required to run the first pass.
- Add up estimated labor hours for every qualifying open work order.
- Divide by your crew’s total weekly productive hours (headcount times hours per week times your realistic wrench time percentage, not scheduled hours).
- The result is your backlog in weeks.
Statistic: Say you have 480 hours of approved work sitting open, and four technicians working 40 hours a week at 65% wrench time (a realistic figure once you subtract travel, meetings, and parts runs) gives you 104 productive hours weekly. That’s 4.6 weeks of backlog.
The most common measurement error is treating every ticket equally. A five-minute light bulb swap and an eight-hour pump rebuild both count as “one work order” if you’re not tracking hours. The second mistake: folding in outsourced, multi-month PM contracts that your own crew was never going to touch anyway.
Prioritization Frameworks to Cut the Backlog Fast
Not every ticket deserves equal urgency, and treating them that way is how backlogs balloon. Start by scoring assets on criticality: how badly does downtime hurt operations, safety, or health outcomes? PNNL’s guidance on prioritizing O&M actions recommends building this scoring around a clear facility mission first, then ranking failure probability and consequence together, rather than letting whoever complains loudest set the queue.
A RIME-style index (risk, importance, mission, effect) removes the guesswork by assigning numeric weights instead of gut feel. It’s worth reviewing those weights annually since asset conditions and mission priorities shift.
Weekly scheduling turns scores into action using a printable caregiver schedule approach to manage shifts and resources efficiently:
- Draft next week’s schedule from the highest scoring open tickets first
- Fill remaining capacity by grouping jobs by location and required skill, cutting travel time
- Lock the schedule by Friday so Monday doesn’t dissolve into renegotiation
The 80% loading rule keeps this realistic: schedule technicians to 80% of available hours, leaving the rest as a genuine buffer for emergencies. Convert your criticality scores into service-level agreements, say, safety items closed within 24 hours, operational items within a week, so everyone knows the rule before a fight breaks out over what jumps the line.
Pro Tip: Build a “break in” rule now, before you need it. Define exactly what qualifies as an emergency that can bump the published schedule, and require a supervisor’s sign-off to invoke it. Otherwise every ticket becomes an emergency by Wednesday.
Cleaning the Backlog: Purge, Validate, and Standardize Work Orders
A backlog full of duplicate tickets and stale wishlist items lies to you about how bad things actually are. Clean it before you try to schedule against it.
- Deduplicate: merge tickets describing the same fault on the same asset.
- Remove wishlist items nobody with budget authority has approved, and reclassify anything that’s really a capital project rather than a work order.
- Review every ticket older than 90 days individually. Batch cancellation is a mistake; some aged items are genuinely obsolete, others have gotten more expensive to defer and need to jump the queue instead.
- Document every cancellation with a reason, so nobody reopens the same fight in six months.
- Standardize labor and parts estimates on remaining tickets so your backlog-weeks number reflects reality, not optimistic guesses from whoever wrote the ticket.
Scheduling and Execution: Weekly Cadence, CMMS, and Resource Matching
Burning down backlog is mostly a discipline problem, not a staffing problem. A dedicated maintenance program that combines asset criticality scoring, SLA enforcement, and a strict weekly review cadence can cut backlog 40 to 60% within 90 days, without adding a single technician.
The mechanics that make this work:
- Group scheduled jobs by location and skill set to cut wasted travel time between tickets
- Reserve 20 to 30% of weekly capacity specifically for backlog burn down, separate from routine PM and reactive calls
- Use your CMMS to auto-flag aging work orders, escalate SLA breaches, and surface “opportunity maintenance”, small fixes worth bundling when a technician is already on-site for something else
- Kit parts in advance for the coming week’s scheduled jobs so a missing gasket doesn’t stall a whole visit
When backlog has grown past what a normal schedule can absorb in a reasonable time frame, bring in contractor support for a short surge rather than letting it linger for months. Pair that surge with real PM implementation, otherwise you’ll burn down the pile only to watch it refill just as fast.
Benchmarks and KPIs to Track Progress
You need more than one number to know whether the backlog is actually under control or just moving around.
- Backlog weeks: most facilities target somewhere in the 2 to 4 week range as healthy, with 4 to 6 weeks as an acceptable upper bound depending on portfolio complexity and mission criticality
- PM vs. reactive ratio: a rising reactive share usually means PMs are being skipped to fight fires, which builds tomorrow’s backlog today
- Wrench time: the share of a technician’s day actually spent on tools, not paperwork or parts runs
- SLA compliance: the percentage of tickets closed within their assigned priority window
- Work order age distribution: a growing tail of 90+ day tickets is an early warning sign, even if total backlog weeks look fine
Read these together. High backlog weeks with strong SLA compliance often points to a resourcing gap. Low wrench time paired with a healthy PM ratio usually means a parts or dispatch problem, not a staffing one.
Sustaining Results: Governance, Communication, and Funding the Proactive Program
Backlogs rebuild the moment weekly review stops. Assign a specific person, usually the maintenance manager or a planner, to own the aging report every week and bring it to a short standing meeting with operations.
- Set clear escalation rules: who gets notified, and when, before an SLA breach becomes a surprise
- Document every priority override so exceptions don’t quietly become the new normal
- Tie backlog data directly to capital conversations; an FCA paired with backlog trends gives facility funding requests real teeth rather than vague budget asks
- Re-run the full prioritization cycle every year or two, since asset conditions and mission priorities shift
Pro Tip: Put the backlog-weeks number on a slide operations leadership sees monthly, not buried in a maintenance report nobody outside the department opens. Visibility is what keeps the budget conversation honest.
How MyLTCApps Supports Backlog Management in Long-Term Care Facilities
For long-term care and skilled nursing facilities, MyLTCApps turns the steps above into something staff will actually use: mobile-first work tickets, aging reports for tracking open items, and PM scheduling that flags overdue tasks before they slip into the backlog count. Front-line staff can log a maintenance request or catch an issue during shift handover in seconds, feeding the aging report your weekly review depends on.
Impact of Maintenance Backlog on Asset Reliability and Operational Costs
A growing backlog doesn’t just sit there quietly. Deferred repairs accelerate wear on adjacent components, turning a $200 fix into a $2,000 replacement once neglect compounds. A worn bearing left unaddressed doesn’t stay a bearing problem; it eventually takes out the motor, the coupling, and the production time lost while parts get expedited.
Reliability data across facility types shows the same pattern: assets running past their intended service intervals fail more often and more unpredictably. Unpredictability is the expensive part. A scheduled repair during planned downtime costs a fraction of the same repair as an emergency callout with overtime labor and rush-shipped parts. Facilities carrying unmanaged backlogs report both higher emergency repair spending and significantly more occupant or tenant complaints than facilities running a structured backlog process.
There’s a budget angle too, one that rarely gets enough attention. A backlog that keeps growing quietly erodes your case for hiring or capital investment, because leadership sees a maintenance department that “can’t keep up” rather than one that’s carrying a documented, quantified gap. The moment you can show backlog weeks trending down alongside SLA compliance trending up, budget conversations shift from defensive to constructive. That shift alone often justifies the time spent building the tracking habit.
Reliability and cost aren’t separate problems here. Every week a critical asset sits in backlog is a week its failure probability climbs, and every failure that could have been scheduled instead becomes an emergency line item nobody planned for.

Integration of Predictive Maintenance to Minimize Backlog Growth
Predictive maintenance doesn’t eliminate backlog, but it changes what fills it. Instead of reactive fire drills clogging your queue, you get scheduled interventions triggered by actual asset condition, vibration trends, temperature drift, run hours past a known failure curve, which can be planned into next week’s schedule rather than dropped into this afternoon’s emergency slot.

The practical effect on backlog math is straightforward. Every reactive repair you convert to a predicted, scheduled one moves labor hours out of the “urgent, unplanned” category and into your normal weekly capacity. That’s fewer break-ins disrupting your locked schedule and a more stable weekly wrench-time number.
You don’t need a full sensor network to start. Equipment downtime tracking, even simple logging of failure frequency and run hours per asset, starts surfacing patterns that let you schedule replacement or service before failure instead of after. Tracking downtime trends over a few months typically reveals two or three assets responsible for a disproportionate share of your reactive backlog. Fix the pattern on those, and total backlog volume often drops without touching staffing levels at all.
At scale, some organizations now apply automated analysis to flag which backlog items are genuinely worth doing versus safe to cancel. One large industrial project used AI-assisted triage to eliminate 67,000 hours of non-value backlog work and cut costs by more than $5 million. That kind of automation makes sense once your ticket volume is in the thousands; for most facility teams, the bigger win is simpler, get the weekly review habit locked in first, then layer predictive signals on top of a process that’s already disciplined. Automation on top of a chaotic process just automates the chaos faster.
Author’s Perspective: Practical Tradeoffs in Backlog Work
Getting operations to buy in matters more than the scoring formula you pick. Start with quick wins, closing the oldest safety tickets first, to earn trust before pitching structural changes like reserved capacity. Keep the backlog-weeks number visible every week, and repeat the prioritization exercise regularly. Metrics that disappear into a report nobody reads stop driving behavior within a month.
— Philip
How MyLTCApps Can Help
Between weekly reviews, SLA tracking, and cleaning out phantom tickets, backlog management generates a lot of paperwork if you’re running it on spreadsheets. The software replaces that with a phone-first system built for long-term care and skilled nursing operations, allowing staff to submit work tickets from their own devices, with tickets carrying aging data automatically and PM schedules flagging overdue tasks before they join the backlog count.
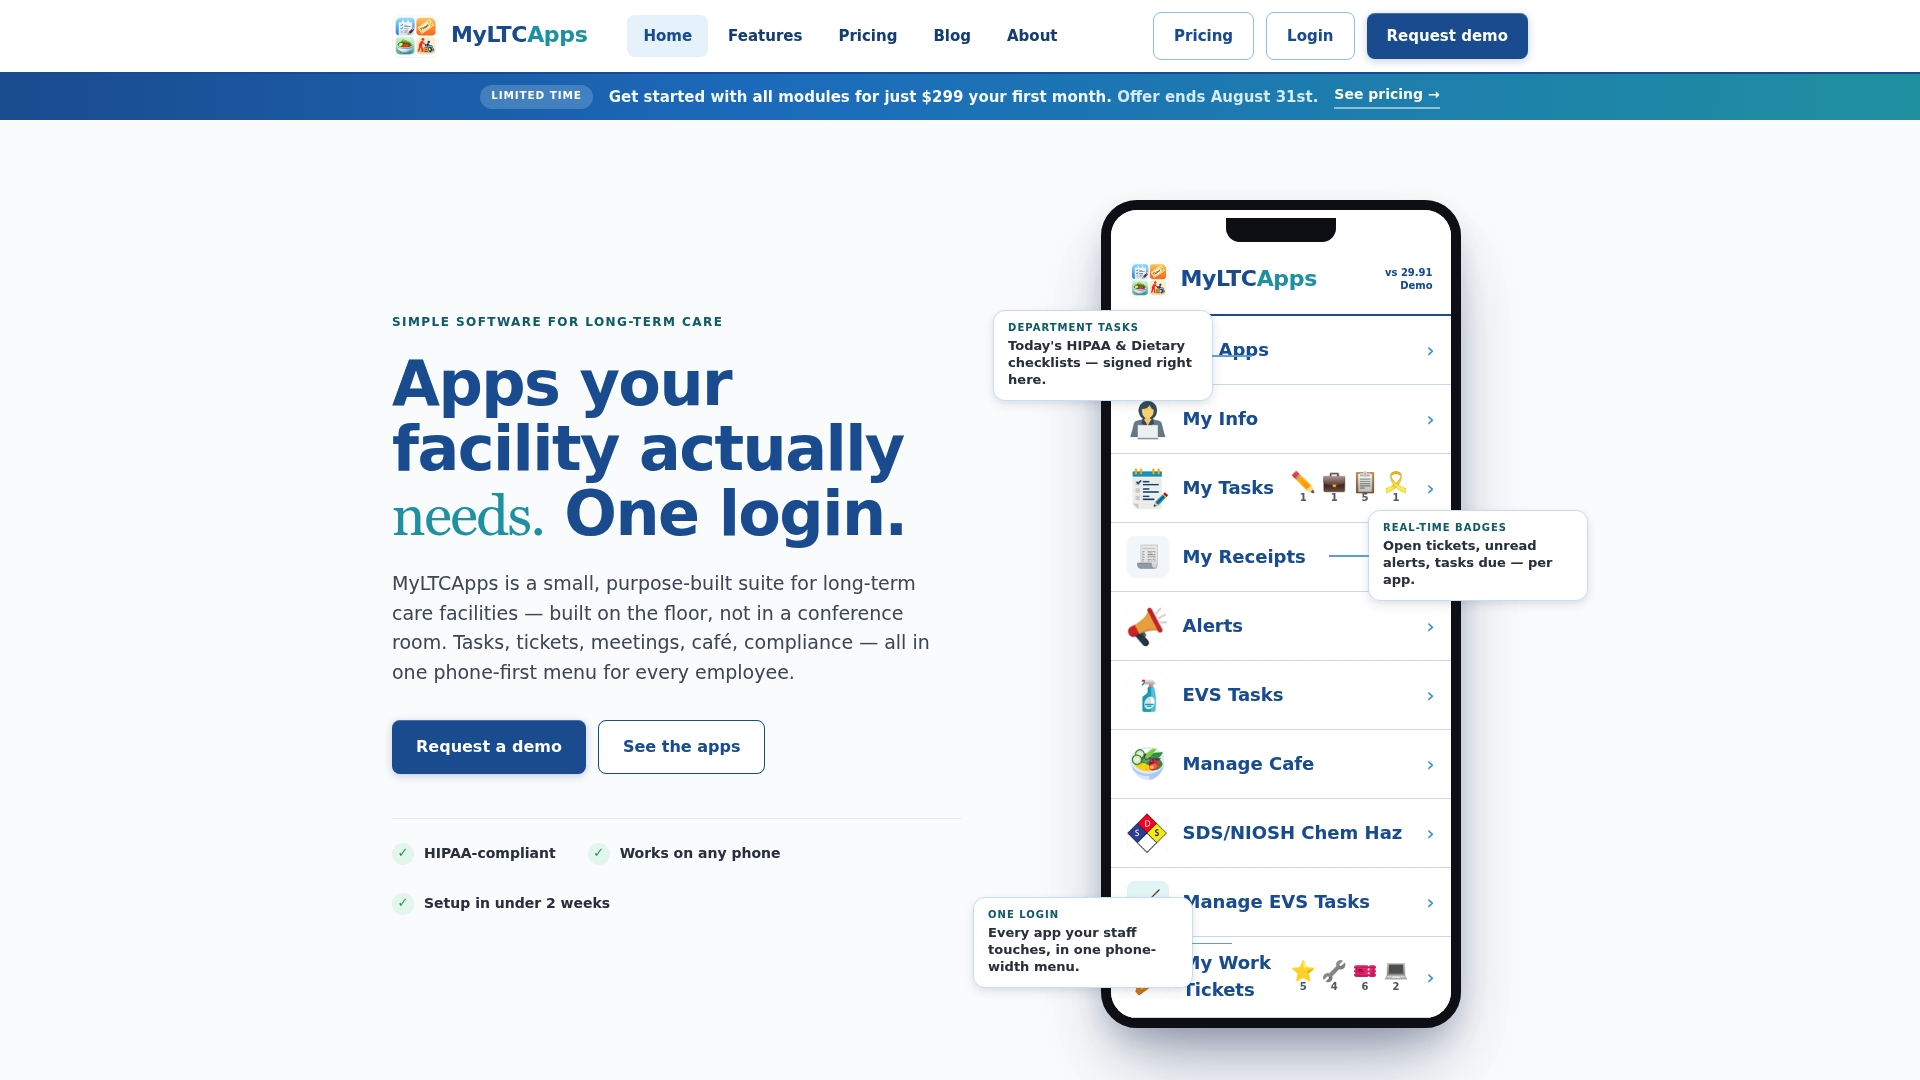
If you’re preparing for a demo, pull your current backlog size in labor hours and identify your five most critical assets beforehand, that context lets a walkthrough focus on your actual numbers instead of generic screens. Facilities in Kansas working toward KDADS readiness can see how the platform maps to state requirements on the Kansas long-term care software page, or explore the full work order and ticketing module directly to see how backlog tracking fits alongside compliance and daily task management in one interface.
Sources
- Management measures: How to calculate your maintenance backlog
- Prioritizing O&M actions
- Facility Maintenance Backlog Reduction Strategy
- Leveraging Artificial Intelligence for Prioritizing and Streamlining Maintenance Backlogs